Performance Monitoring with PerfMon
PerfMon (Microsoft Windows Performance Monitor) is a free, Windows built-in tool that helps us to analyze resources utilization and identify possible performance issues. Running PerfMon locally on a computer has a tiny impact on the computer’s performance but the automatically generated report is pretty useful for overall overview and its easier read.
Adding Counters by a Template (Basic)
If you need to get the current performace quickly, you can do the following steps to get a nice report about the server performance.
Right click User Defined> New Data Collector Set > Give a Name and select create from a template> Choose System Performance> Next > Next Finish.
Under "User Defined" section a new Data Collector Set is created > Right click and select Start > Wait a few minutes and stop it.
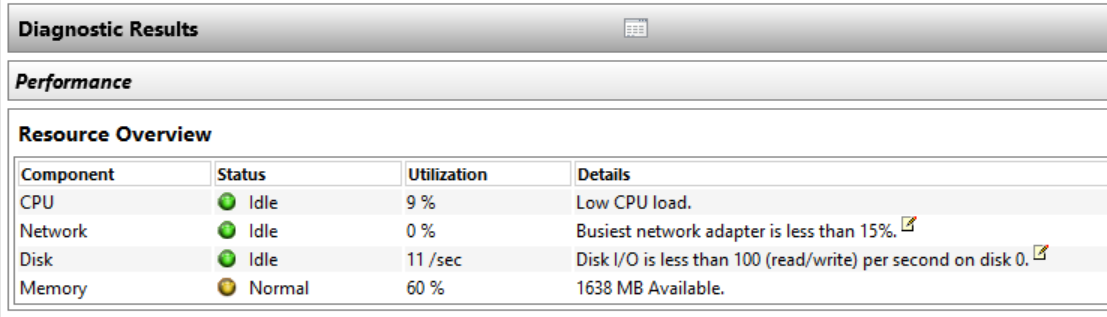
Right Click the Data Collector Set again > choose Latest Report. This section of the report is pretty nice and easy to see performance issues.
Adding Counters Manually (Advanced):
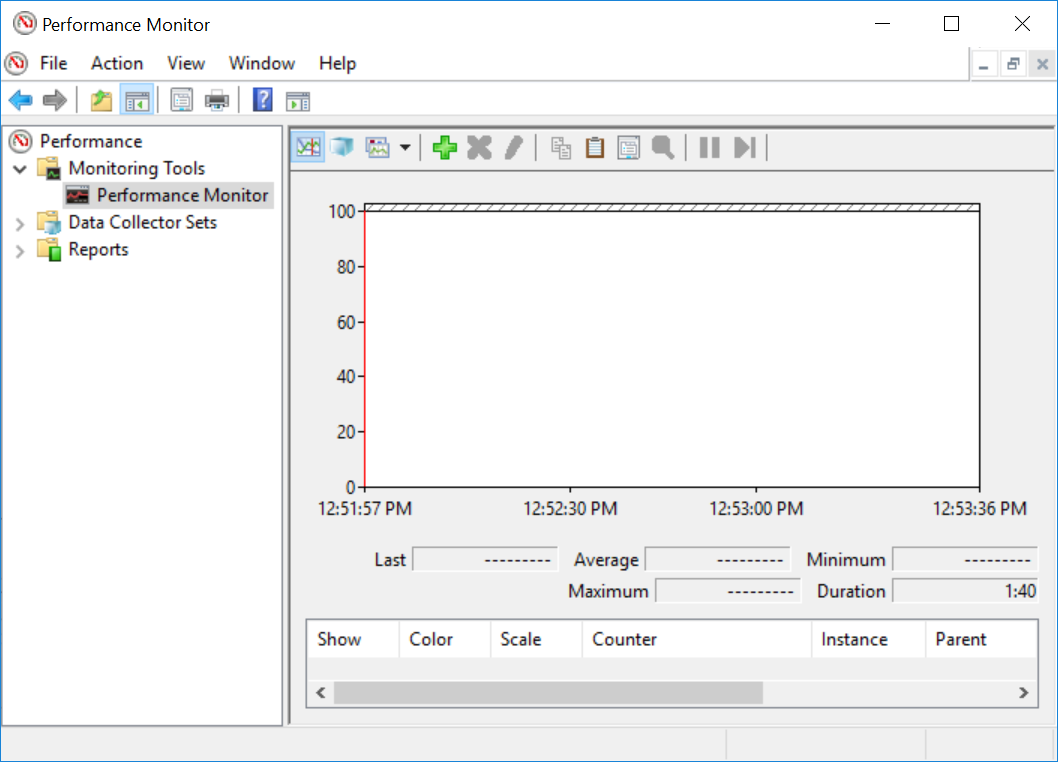
To Run PerfMon, navigate to Control Panel\All Control Panel Items\Administrative Tools > Double Click Performance Monitor.
Select Performance Monitor > Local Computer’s Processor Time Counter added by default Click Remove icon (X) to remove it and then Click Add icon (+)
Click Browse and Select the Remote Server to Monitor > Select Memory Section > Under the Memory Section choose “Available MBytes” > Click Add and OK.

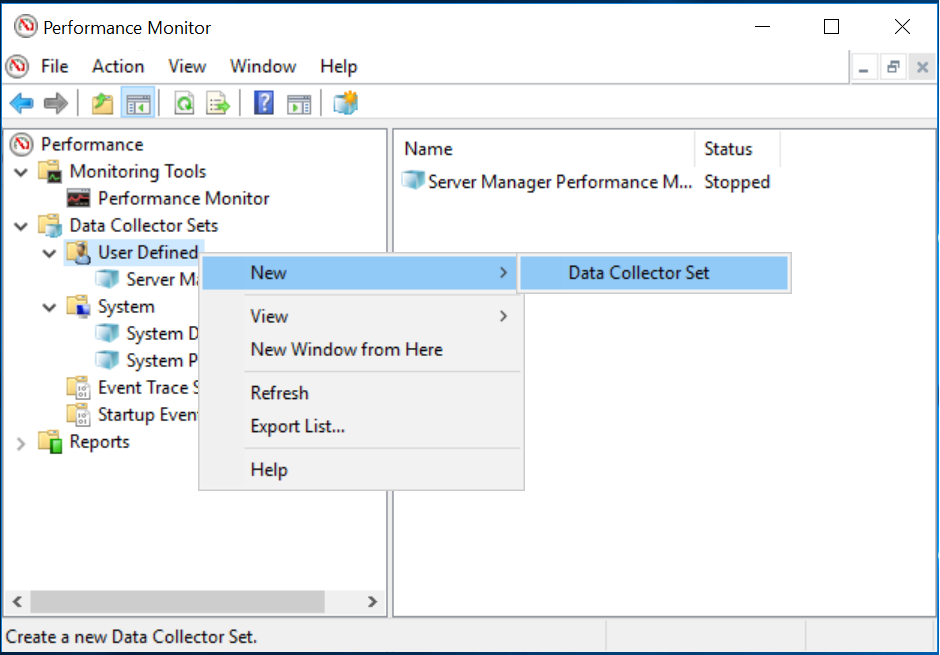
This is how we can add a counter. You can add many different counters following this procedure. This kind of monitoring is real-time though and it is not saved. We can create a Collector Set to record counters. Navigate to Data Collector Sets > User Defined > New > Data Collector Set

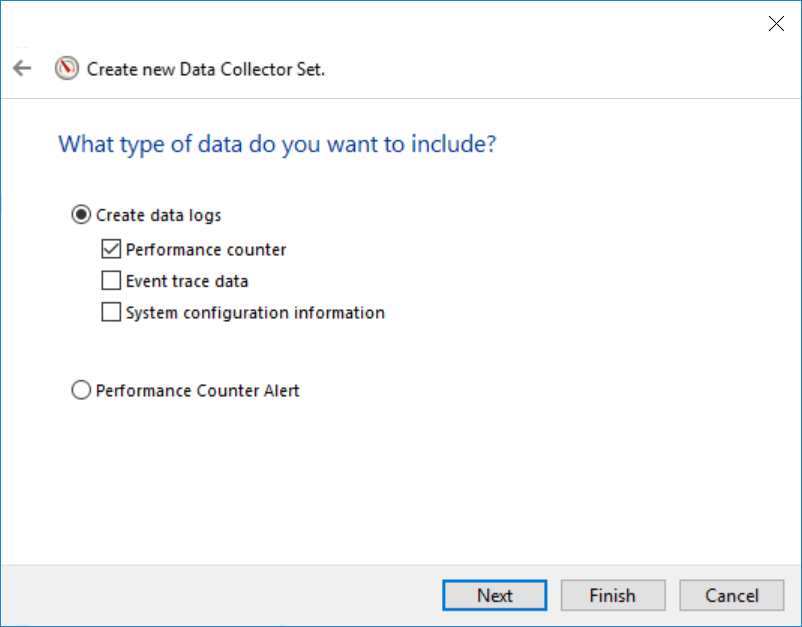
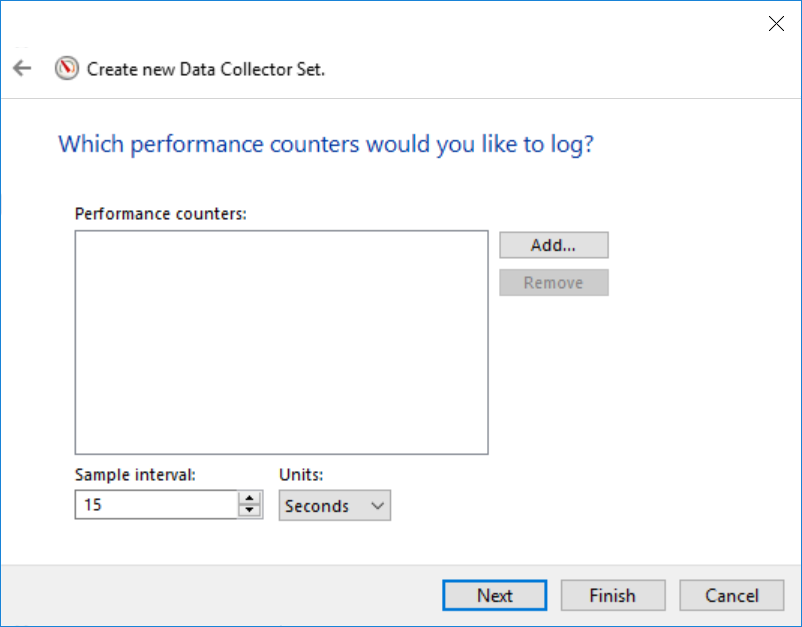
Give a name for the Collector Set> You can either select a template or manually define the counters
Click Add
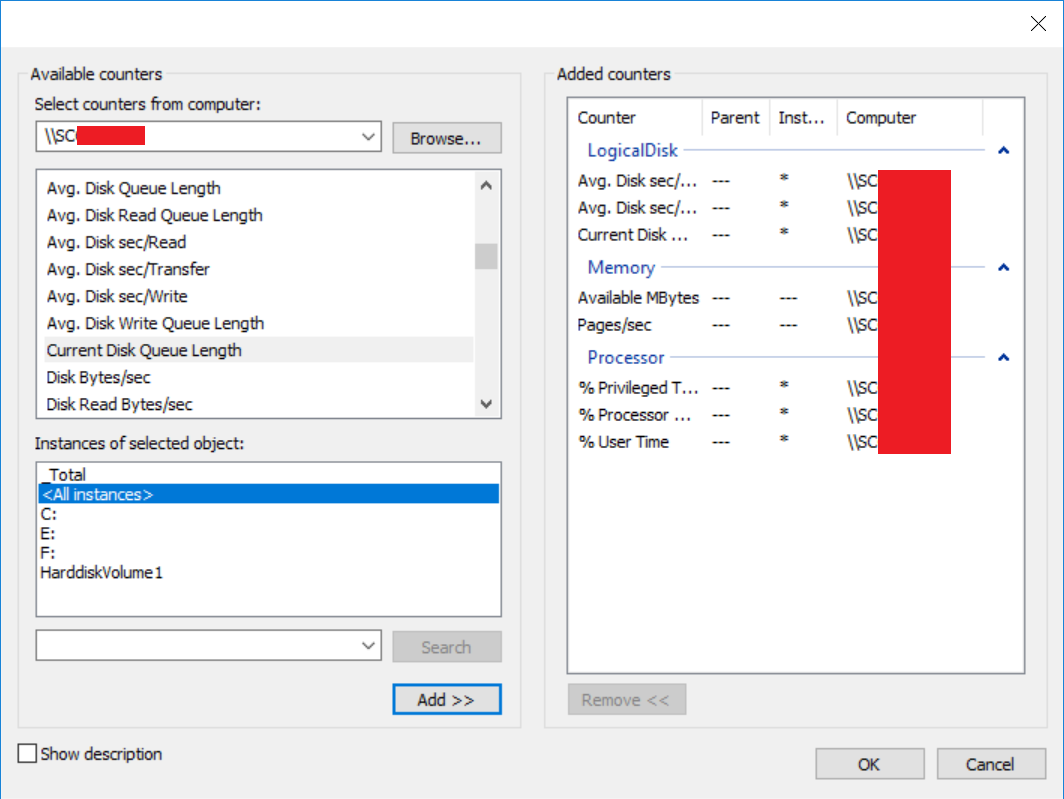
The counters I want to monitor are in the below screenshot. Choose the counters and click OK. Make sure "Add Counters" on the right screen displays the remote computer as the computer name. If it does not show the remote computer name and displays nothing, then remove the counters and type in \\RemoteComputerName like this. Otherwise it will monitor the local computer.
You can find detailed explanation and their meaning and acceptable value for these counter below.Show description box can also be checked to see the details.
[Processor] "% Processor Time"
This shows percentage of total elapsed time to execute a task. Simply how busy the processor is. If it is constantly high for example more than 90%, you need to check other counters to find the reason behind.
[Processor] "% Privileged time"
This measures the percentage of elapsed time the processor spent executing in kernel mode. Since this counter takes into account only kernel operations (eg. memory management) a high percentage of privileged time, anything consistently above 25%, can usually point to a driver or hardware issue and should be investigated.
[Processor] "% User time"
The percentage of elapsed time the processor spent executing in user mode. To describe this simply, it's really the amount of time the processor spent executing any user application code. Generally, even on a dedicated SQL Server, I like this number to be consistently below 65% as you want to have some buffer for both the kernel operations mentioned above as well as any other bursts of CPU required by other applications. Anything consistently over 65% should be investigated and this might mean digging deeper into exactly what process is using the CPU (if it's not SQL Server) by using the "[Process] % User time" counter for the individual processes.
[Memory] "Available MBs"
The total amount of available memory on the system. Usually you would like to keep about 10% free but on systems with a really large amounts of memory (>50GB) there can be less available especially if it is a server that is dedicated to just a single SQL Server instance. If this value is lower than this then it's not necessarily an issue provided the system is not doing a lot of paging. If you are paging then further troubleshooting can be done to see which individual processes are using most of the memory.
[Memory] "Pages/sec"
This is actually the sum of "Pages Input/sec" and "Pages Output/sec" counters which is the rate at which pages are being read and written as a result of pages faults. Pages/sec is the rate at which pages are read from or written to disk to resolve hard page faults. This counter is a primary indicator of the kinds of faults that cause system-wide delays. Small spikes with this value do not mean there is an issue but sustained values of greater than 50 can mean that system memory is a bottleneck.
[Logical Disk] "Avg. Disk sec/Transfer"
This metric measures the amount of time in seconds that the average I/O request requires to complete. This can be considered a true disk LUN response time because the timer is activated when the I/O is extracted from the disk queue and it is terminated when a processor handles the I/O completion. If this value is greater than 0.040 seconds (40 milliseconds) for long periods, the disk LUN is struggling to keep up with the presented workload, so the pressure should be alleviated by workload reduction or hardware upgrade.
[Logical Disk] "Avg. Disk sec/Write"
This metric measures the amount of time in seconds that the average write I/O request requires to complete. This value can be especially useful in RAID 5 environments because it will indicate clearly when the disk LUN is asked to handle too many writes. If this value is greater than 0.040 seconds (40 milliseconds) for long periods, the disk LUN is struggling to keep up with the write workload.
[LogicalDisk]Current Disk Queue Length
Current Disk Queue Length is the number of requests outstanding on the disk at the time the performance data is collected. It also includes requests in service at the time of the collection. This is a instantaneous snapshot, not an average over the time interval. Multi-spindle disk devices can have multiple requests that are active at one time, but other concurrent requests are awaiting service. This counter might reflect a transitory high or low queue length, but if there is a sustained load on the disk drive, it is likely that this will be consistently high. Requests experience delays proportional to the length of this queue minus the number of spindles on the disks. For good performance, this difference should average less than two.
Collector Data Set will be saved in the follwing location
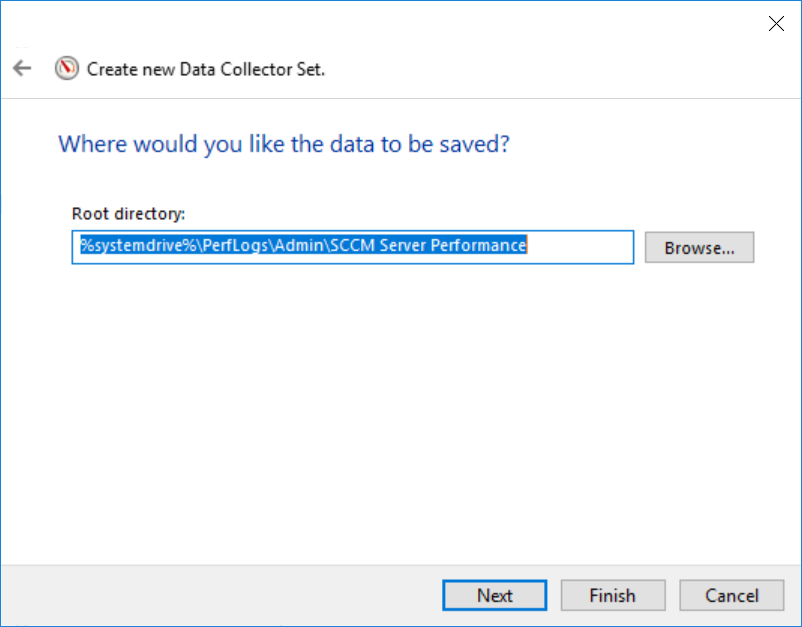
Enter the credentials of a user who has admin rights on the remote server. Click finish. You can save this Collector set as a Template if you right click on it. You can aslo Schedule Data Collector Set from its Properties if you need to run it on some specific time intervals.

Let’s start Data Collector set to collect data for the counters we set. Let it run for a few minutes and then stop it.
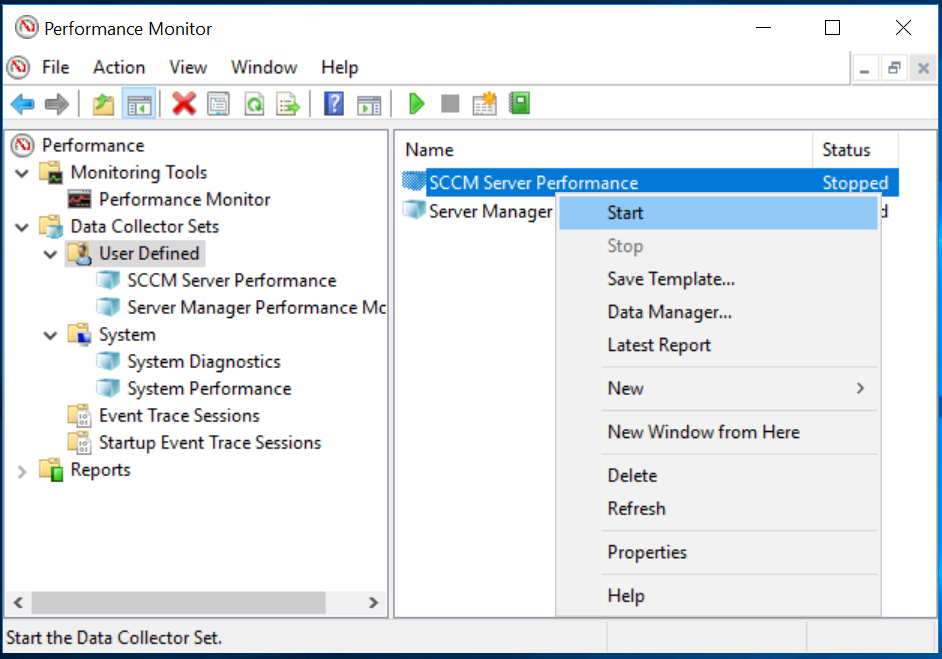
Right Click on the Data Collector Set > Choose Latest Report to see the generated report and performance counters.
- Hits: 540